Leaderboards & Player Motivation


Executive summary
A leaderboard is not a retention feature by default. It amplifies motivation that already exists. Those important questions should be addressed before the initial stage of the project starts
My advisory work focused on three aspects:
Align on success and KPIs
Identify the gap between hypothesis and implementation
Propose a practical plan that works inside unit economics and engineering constraints
Turning a flat pilot into a measurable retention system
Client
The client shipped a competition pilot. It did not move retention in a meaningful way, only around 2% and looked like noise. Leadership still believed in the idea and wanted an expert behavioural view on what went wrong and what to do next.
Metrics
Reward-based mobile app, play-to-pay model
Predominantly Android
500k+ DAU
Typical weekly payoff 2-20 EUR
Primary goal
Improve retention D2 and D30
Business alignment & metrics
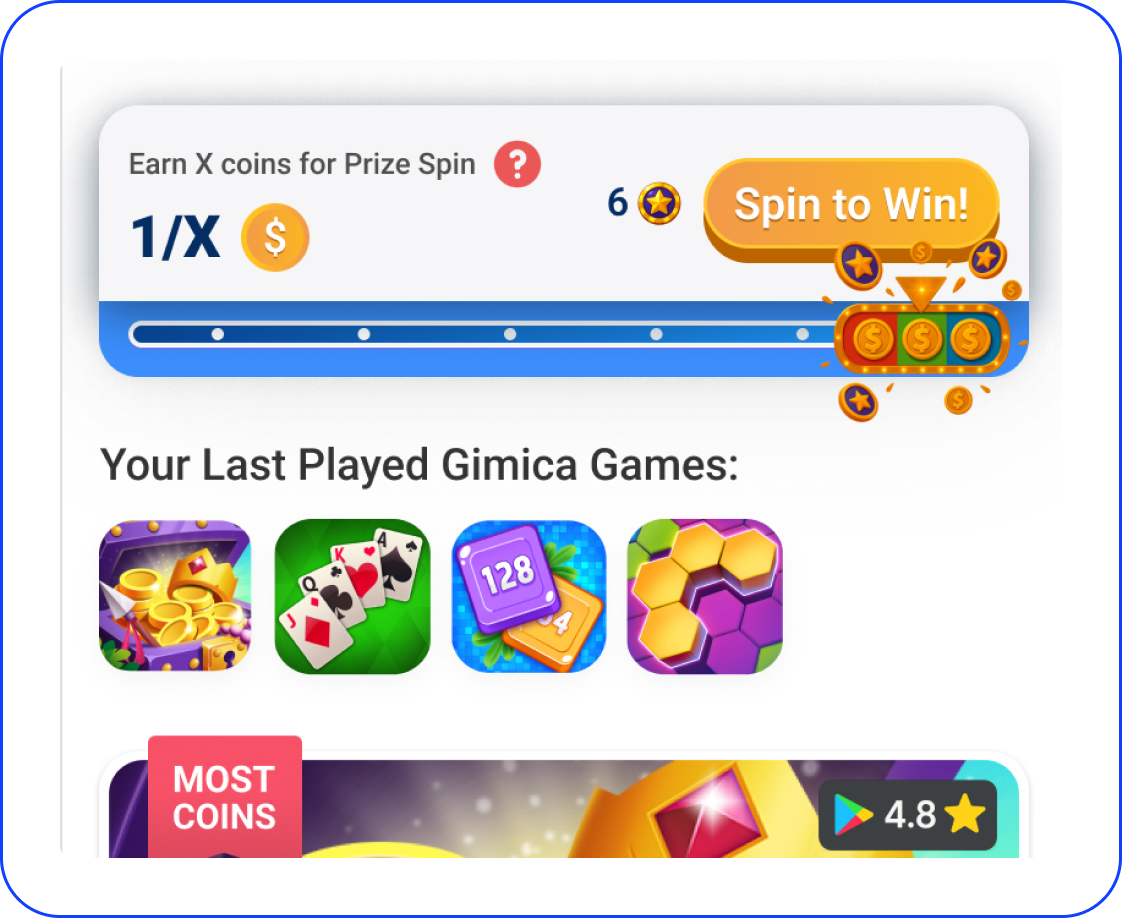
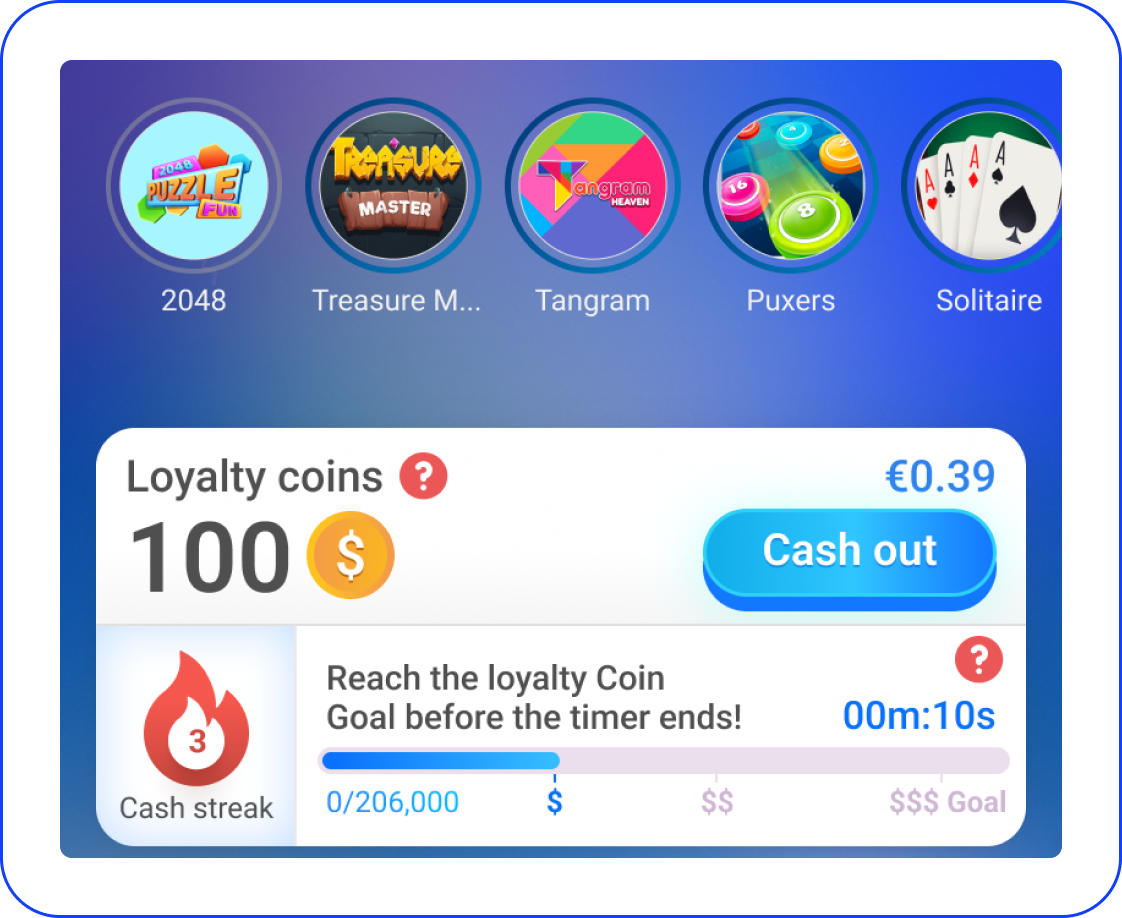
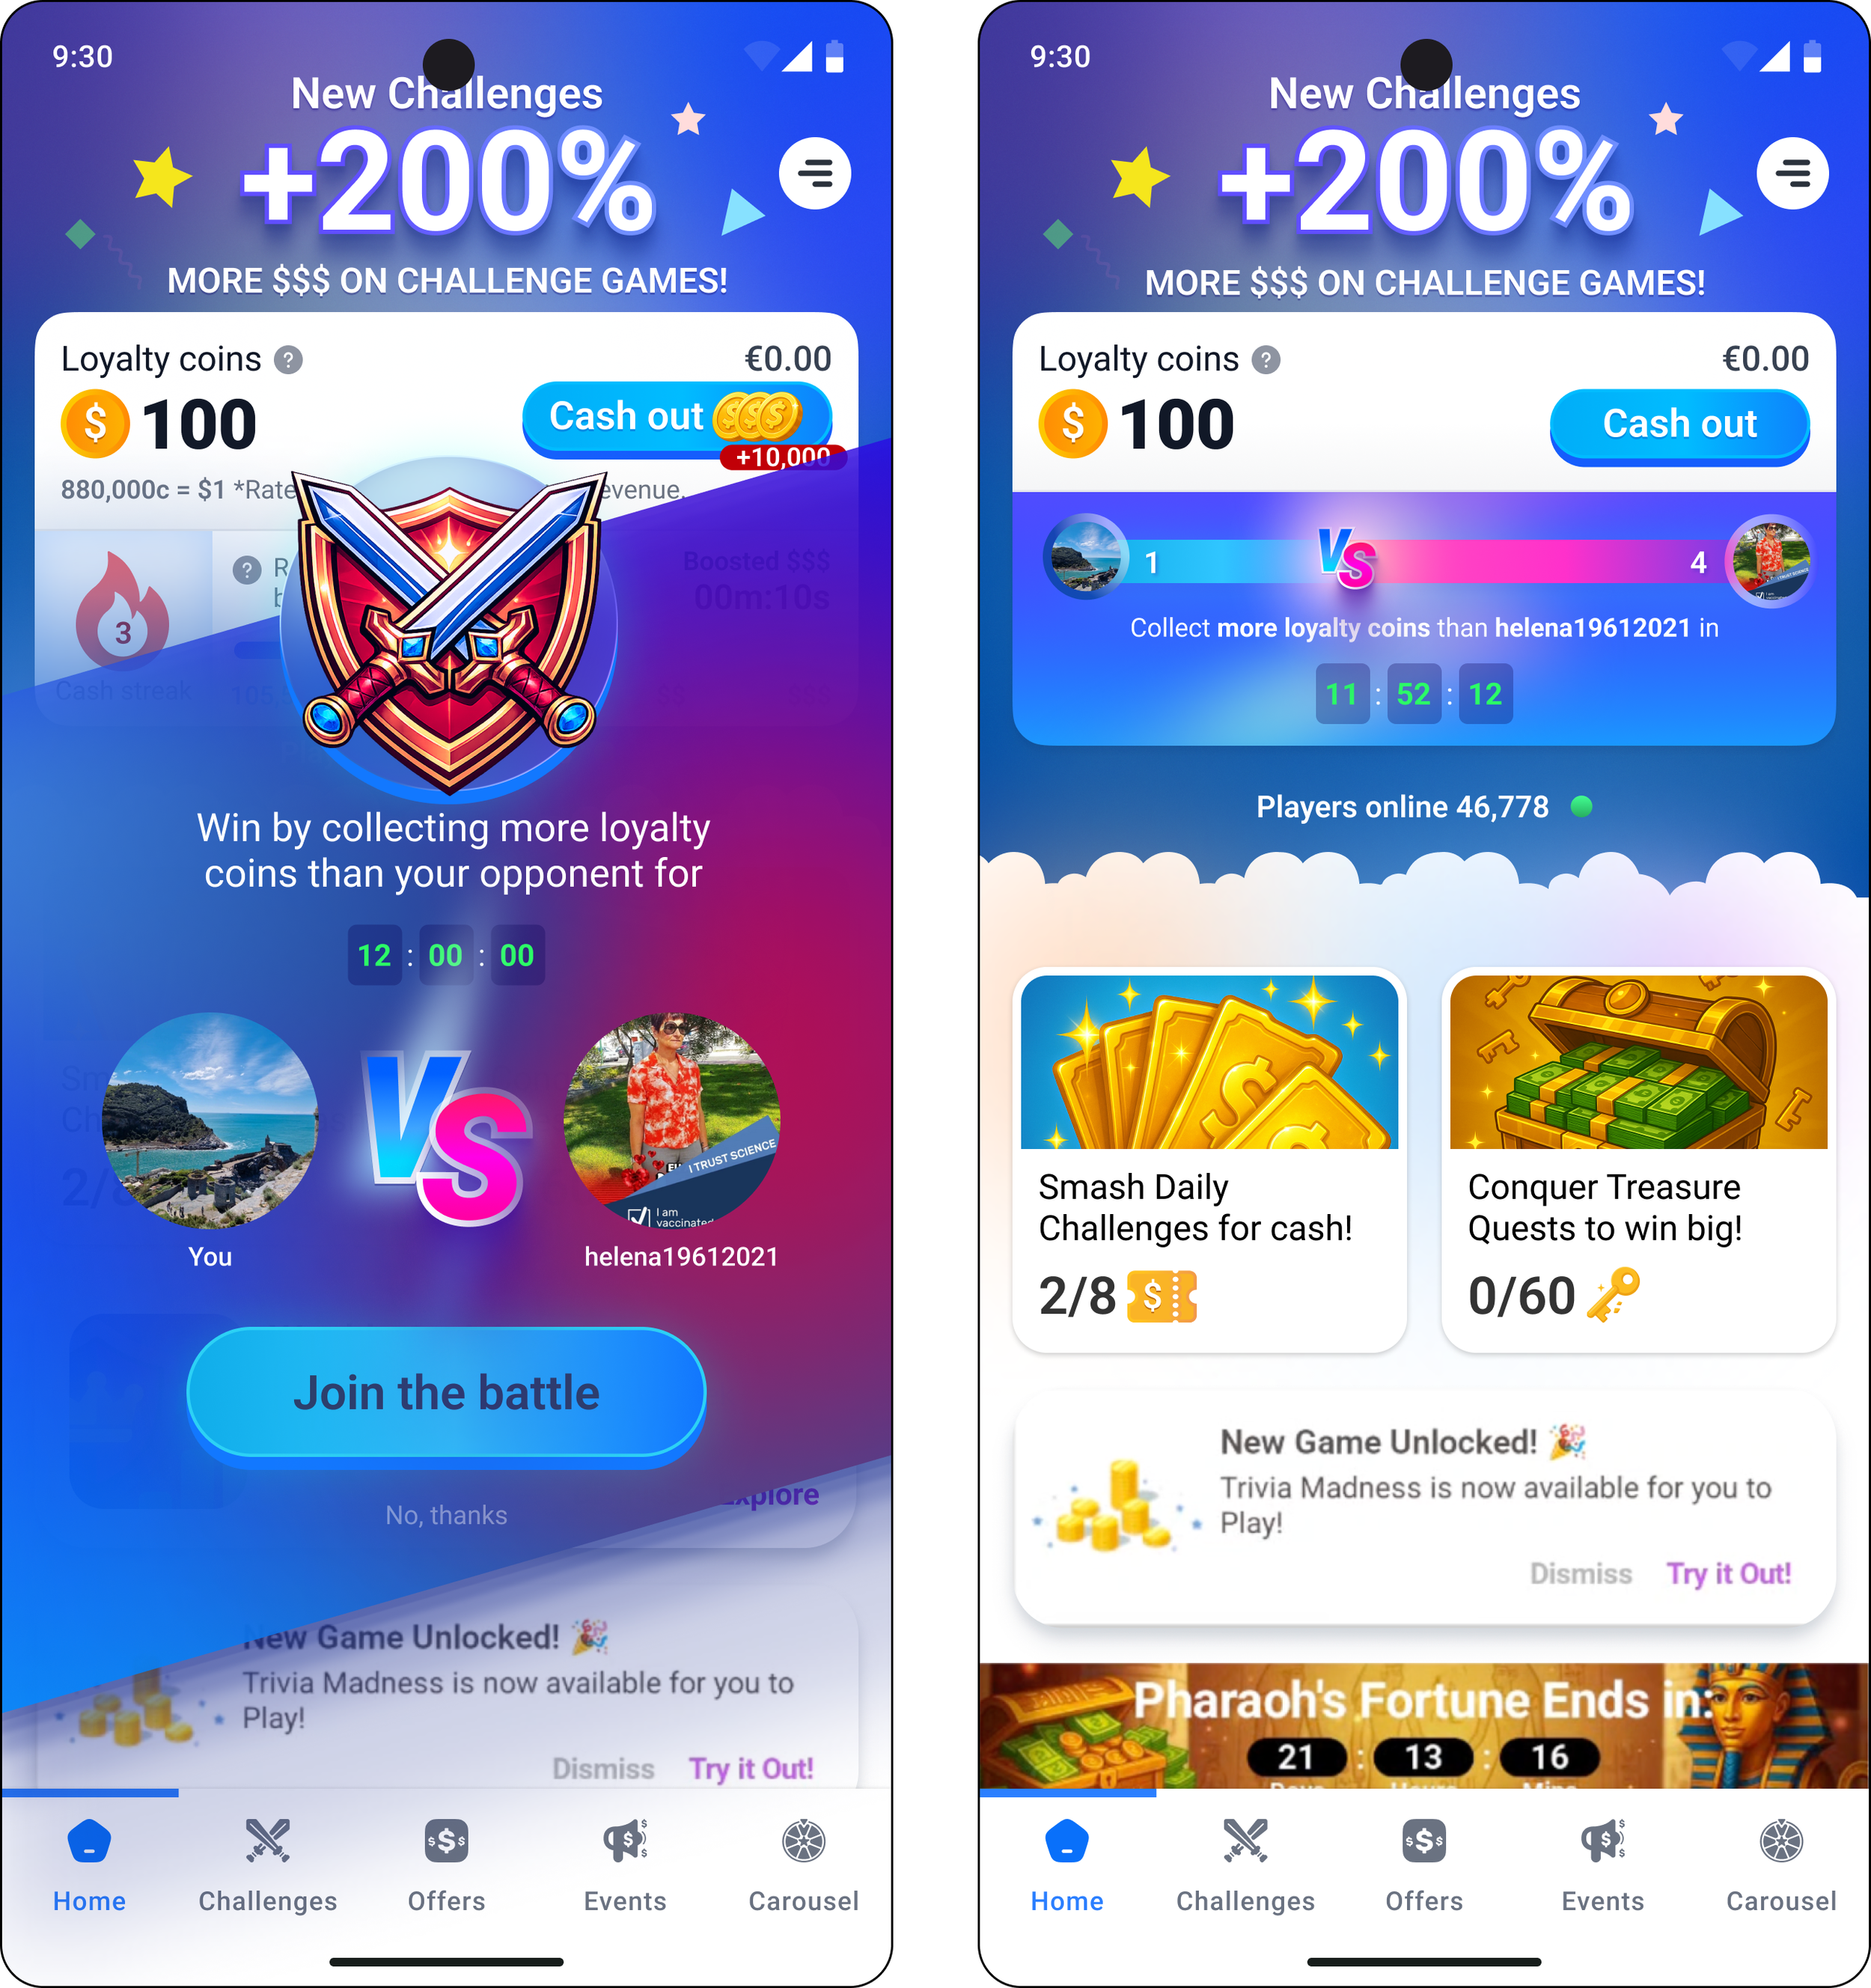
Mockups provided by the client
Massive acquisition, but a retention gap
500k DAU, 25M installs
High initial churn
Users download, realise it takes time, effort, and watching multiple ads to earn 2€ and then quit. This cohort generates about 1€ or less in revenue on top of acquisition costs.
Earners
People who stay longer generate more revenue. Classic churners vs earners. To cover the 2€/week payoff, users should generate +30% profit and cover 15-20% of infrastructure costs. That means a min of 3.5€/week in ad revenue. Average active days for the mid-tier users are around 10 Days, but they churn just before they become highly profitable.
General leaderboard
Format: Weekly leaderboard / 100 participants per cohort . Users grouped close to each other by the coins earned that week
AB-test. 50k users cohort 40-day test
Coin source. Coins earned through watching ads
Rewards. Mostly status , no tangible rewards
Outcome. Minimal retention movement, no clear signal on D2 and D30
500k DAU is a sticky core
With a focus on mid-tier low payout users
Who are they? They likely have a specific psychological profile (grinders, hoarders, or brain rotters). It’s an important task to explore their motivation and behavioural drivers.
Design Implication. The leaderboard should not try to save the users who quit on Day 1, yet.
It should focus on extending the life of the D7–D30 user. If it turns a 2-week user into a 4-week user, that 500k DAU gives a boost to revenue without any costs for marketing or new acquisition.
Potential pitfalls. Depending on the reward system, there is a higher risk of cheating and fraud.
Unit economics sustainability might be affected by introducing a leaderboard and offering rewards to increase engagement.
“Who am I there? And where? Why should I care about those people and me being among them on those leaderboards?”
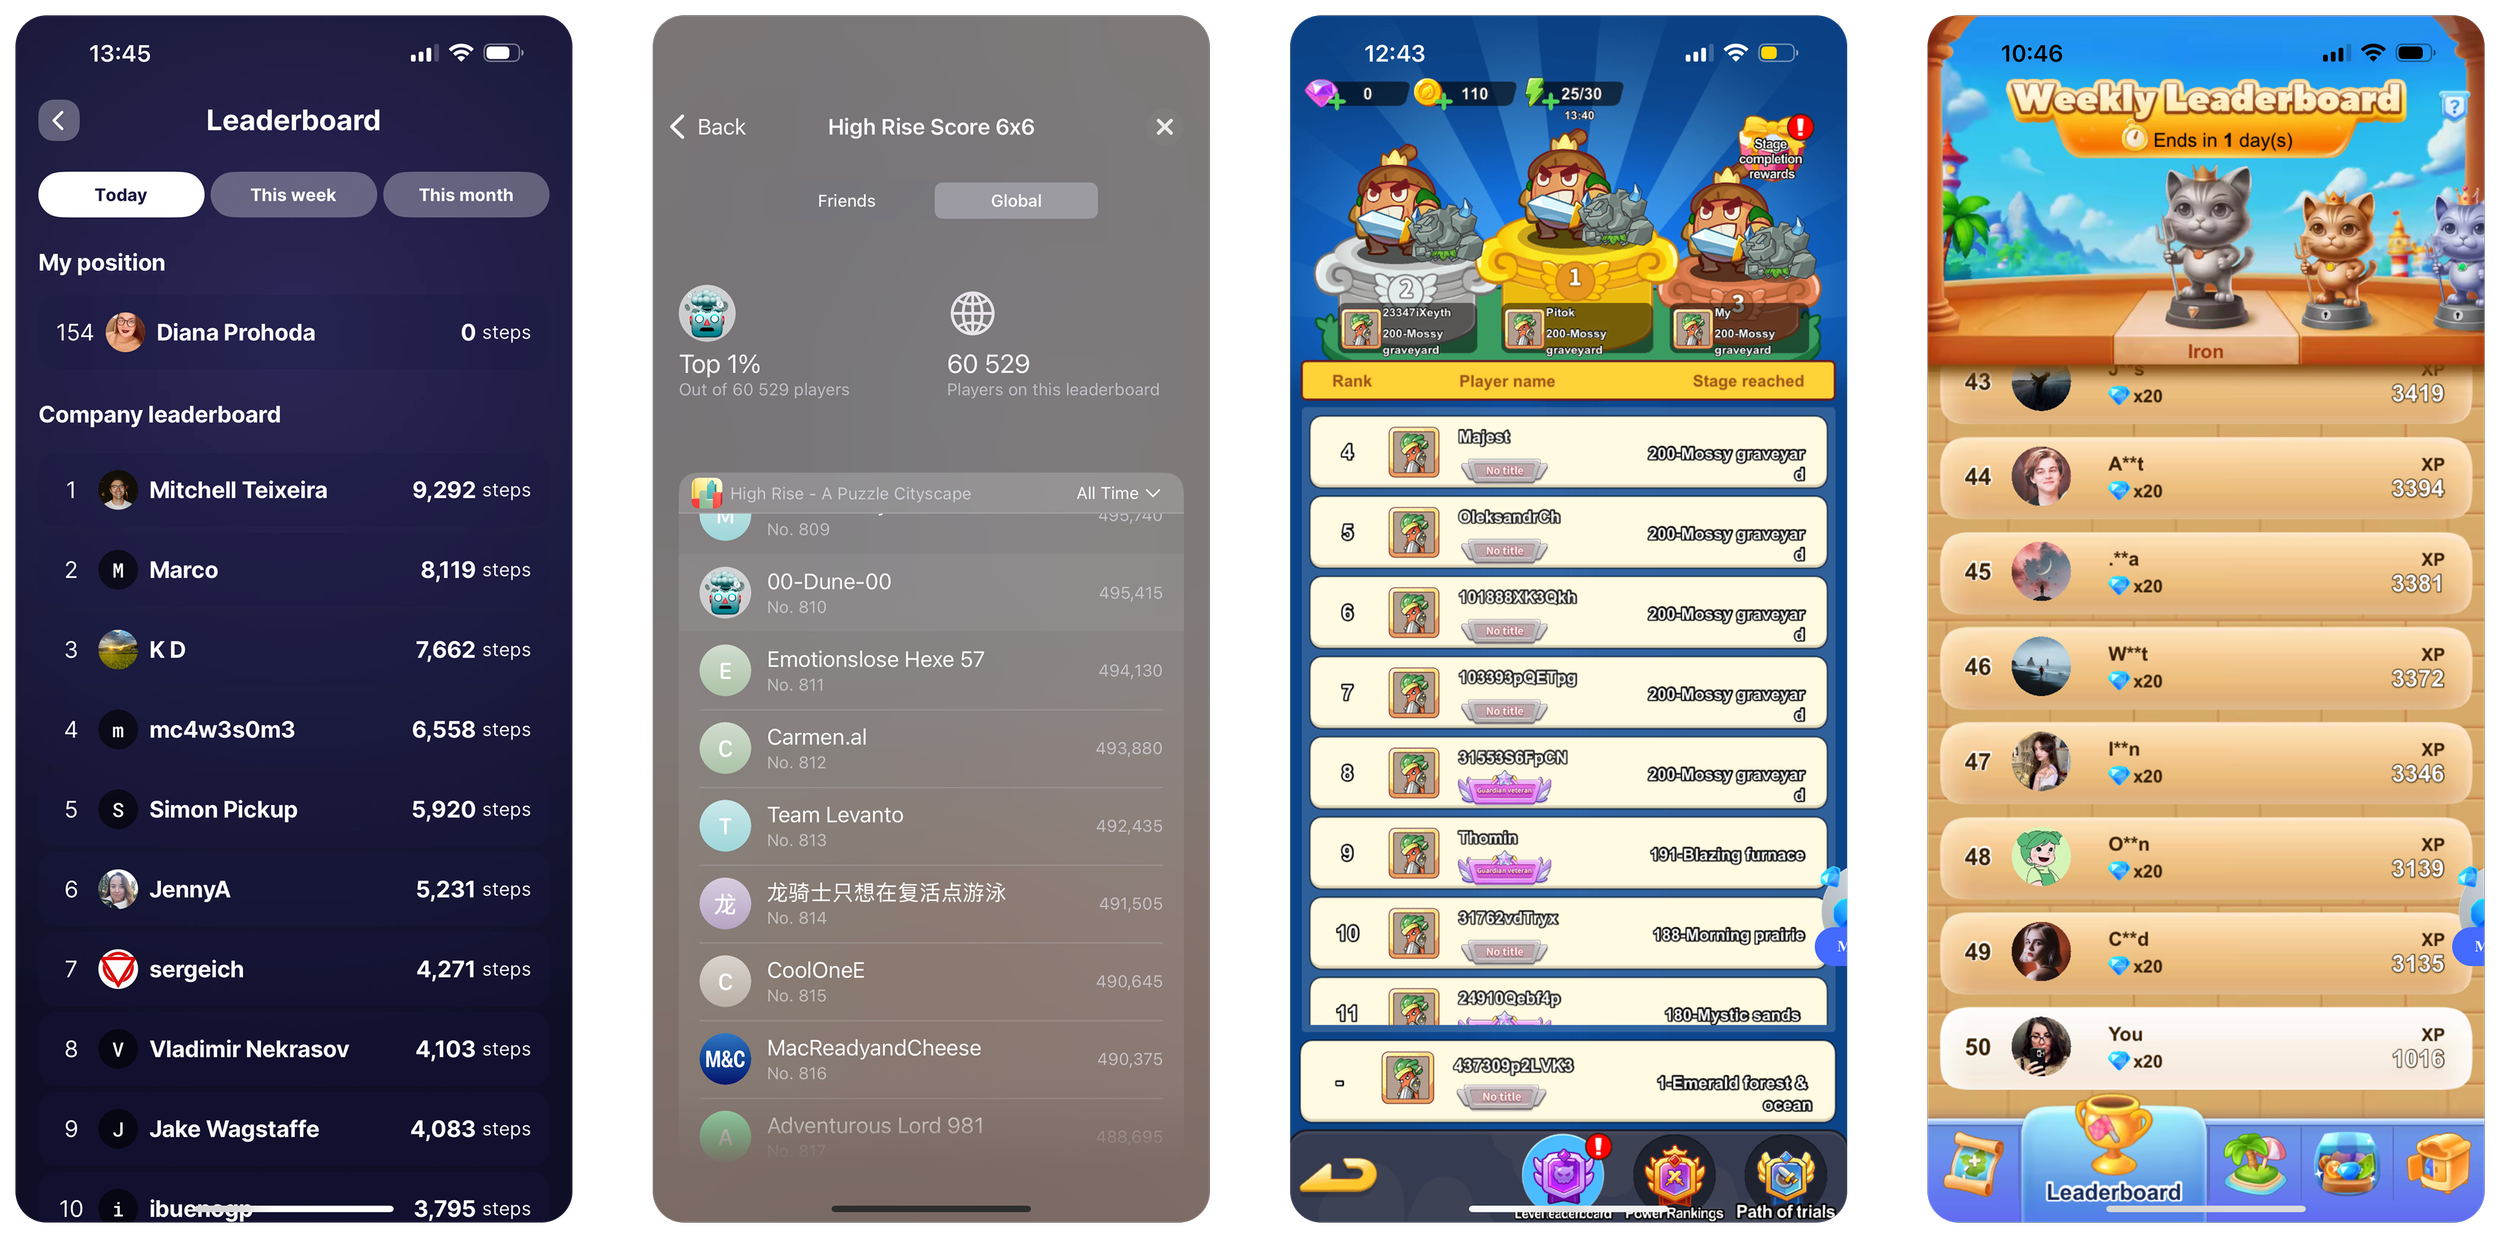
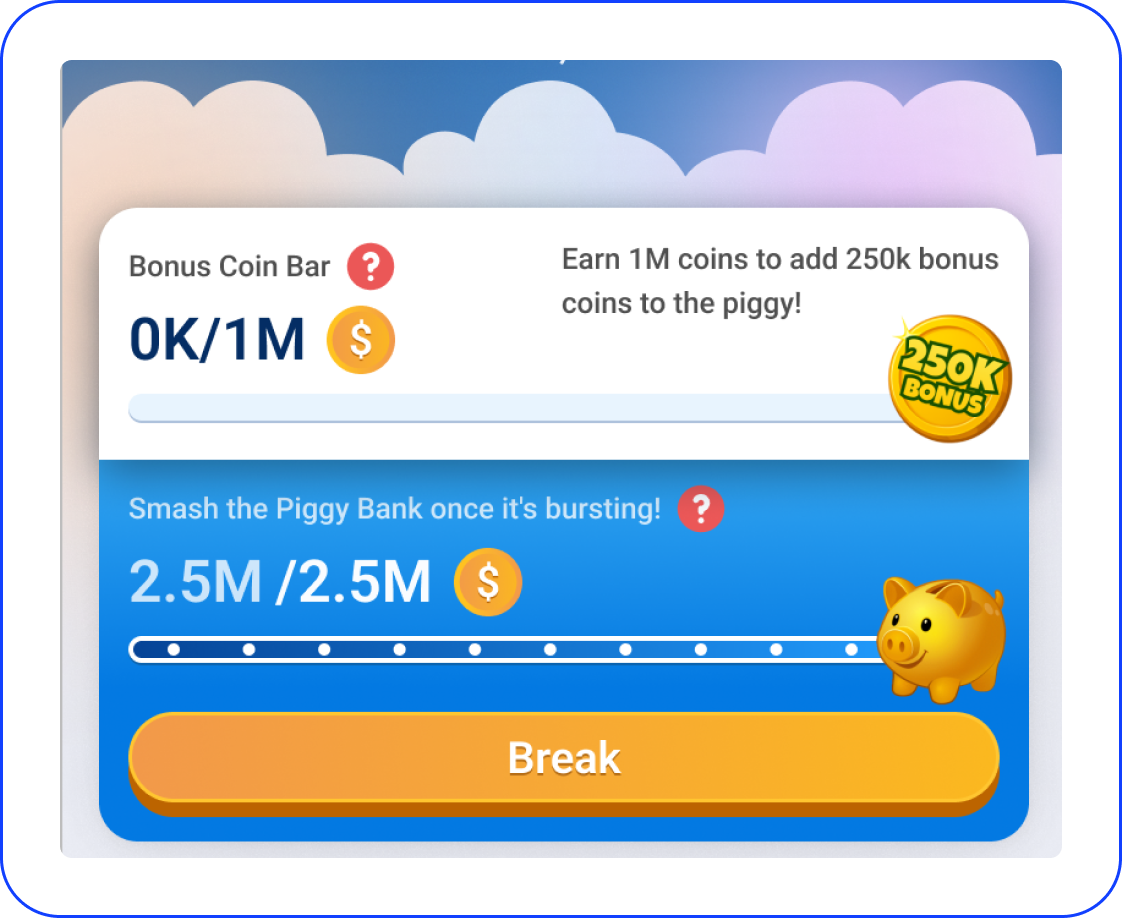
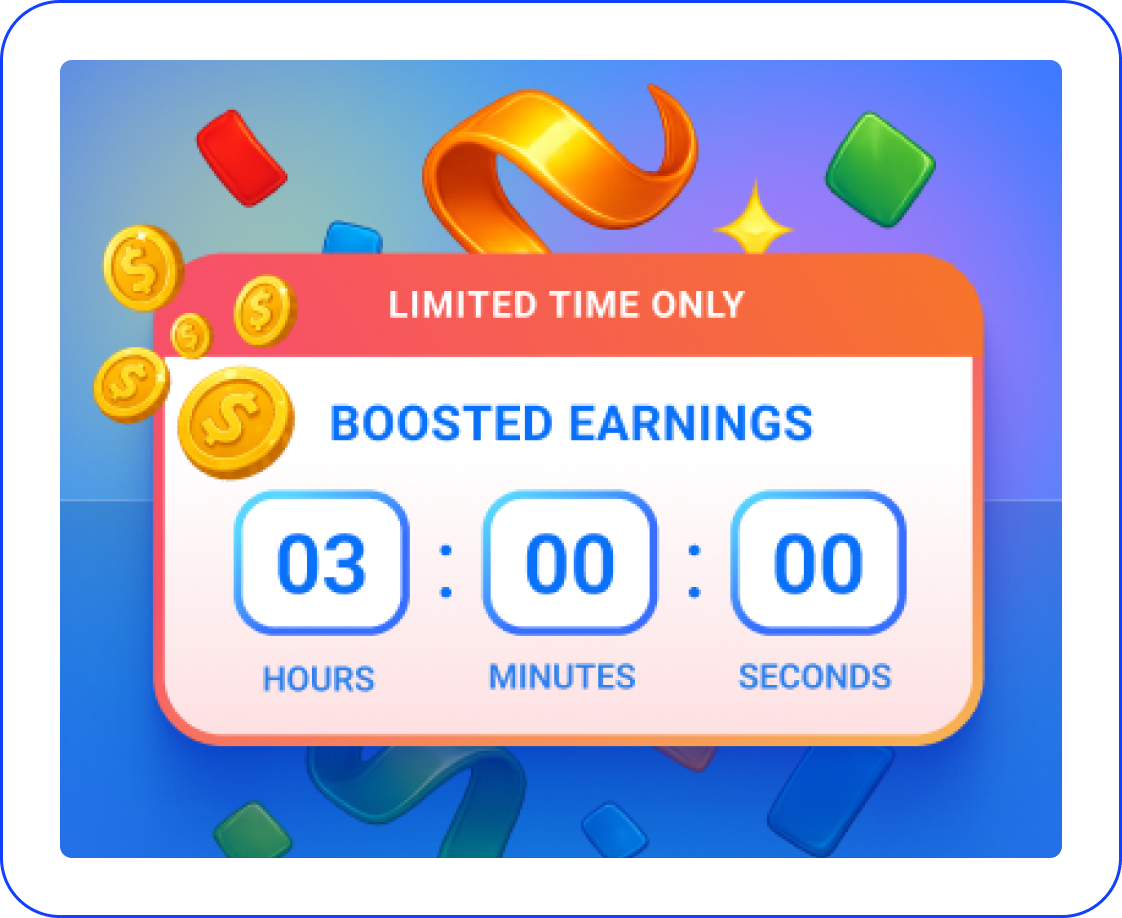
Some leaderboard examples
General leaderboards don’t work and have negative impact on retention
Why compete if I can’t win?
Recent studies indicate that while competition boosts engagement among top performers, it creates toxicity and churn among the bottom of the cohort. It makes a significant impact on retention.
People’s motivation
Leaderboards increase motivation only for the top 10-15% but DECREASE motivation for the bottom 70%. Creates helplessness, not engagement. As well as increase anxiety, fear of loss, and other related emotions. On a deeper level, motivated by dealing with daily stress, feeling capable and in control in reality, by playing casual games.
Recent interesting research about leaderboards and user behaviour

Practical solutions
Importance of POC
Leaderboard is a high-effort feature with unclear ROI and real risks for retention. So the POC should not try to prove a complete leaderboard system. It should prove that users want to participate in comparison. Later, it might be scaled into the leaderboard system.
Leaderboard’s entry point is the product decision, not developing and shipping the leaderboard table as a POC.
If the leaderboard creates helplessness, it will backfire. The core design question is not “who wins”. It is “Do users feel capable of progressing?”
The major gap
Hypothesis
Competition increases competitive spirit → Competitive spirit increases retention
Reality of the shipped system
Status-only rewards lowered the perceived value of winning. Weekly cadence slowed momentum, and limits on near-real-time updates weakened feedback. Most users could not see a believable path to progress.
It created a feature people could glance at, but not become stuck in an engaging loop that will make them want to return.
POC implementation plan

Fakedoor test
low infrastructure costs
ghost data to test
First KPI is simple: do people choose to step into comparison?
Second KPI: whether people return to check progress

P2P battles
limited scope, short duration
simplified or semi-ghost data
First KPI is simple: do people actually compete?
Second KPI: do they come back to accept another battle?

Leaderboard
medium infrastructure costs
real data, limited cohort
First KPI is simple: do people join the league when participation is optional?
Second KPI: whether people return to check their position
Stage 01. Fakedoor test
Framing
Weekly Activity Rank
Entry point
Small module on Home
CTA
See how active you were this week compared to others
Action
Show a fake pop-up ranking design. Add a competitive element and potential rewards
How does it correlate with leaderboards?
To measure people’s interest in ranking. Do they even care?
Metrics
Tap rate (baseline interest)
D2 / D7 / D30 return rate among users who tapped
Change in active days vs control cohort
Streak continuation rate after exposure
Weekly Activity Rank module tests
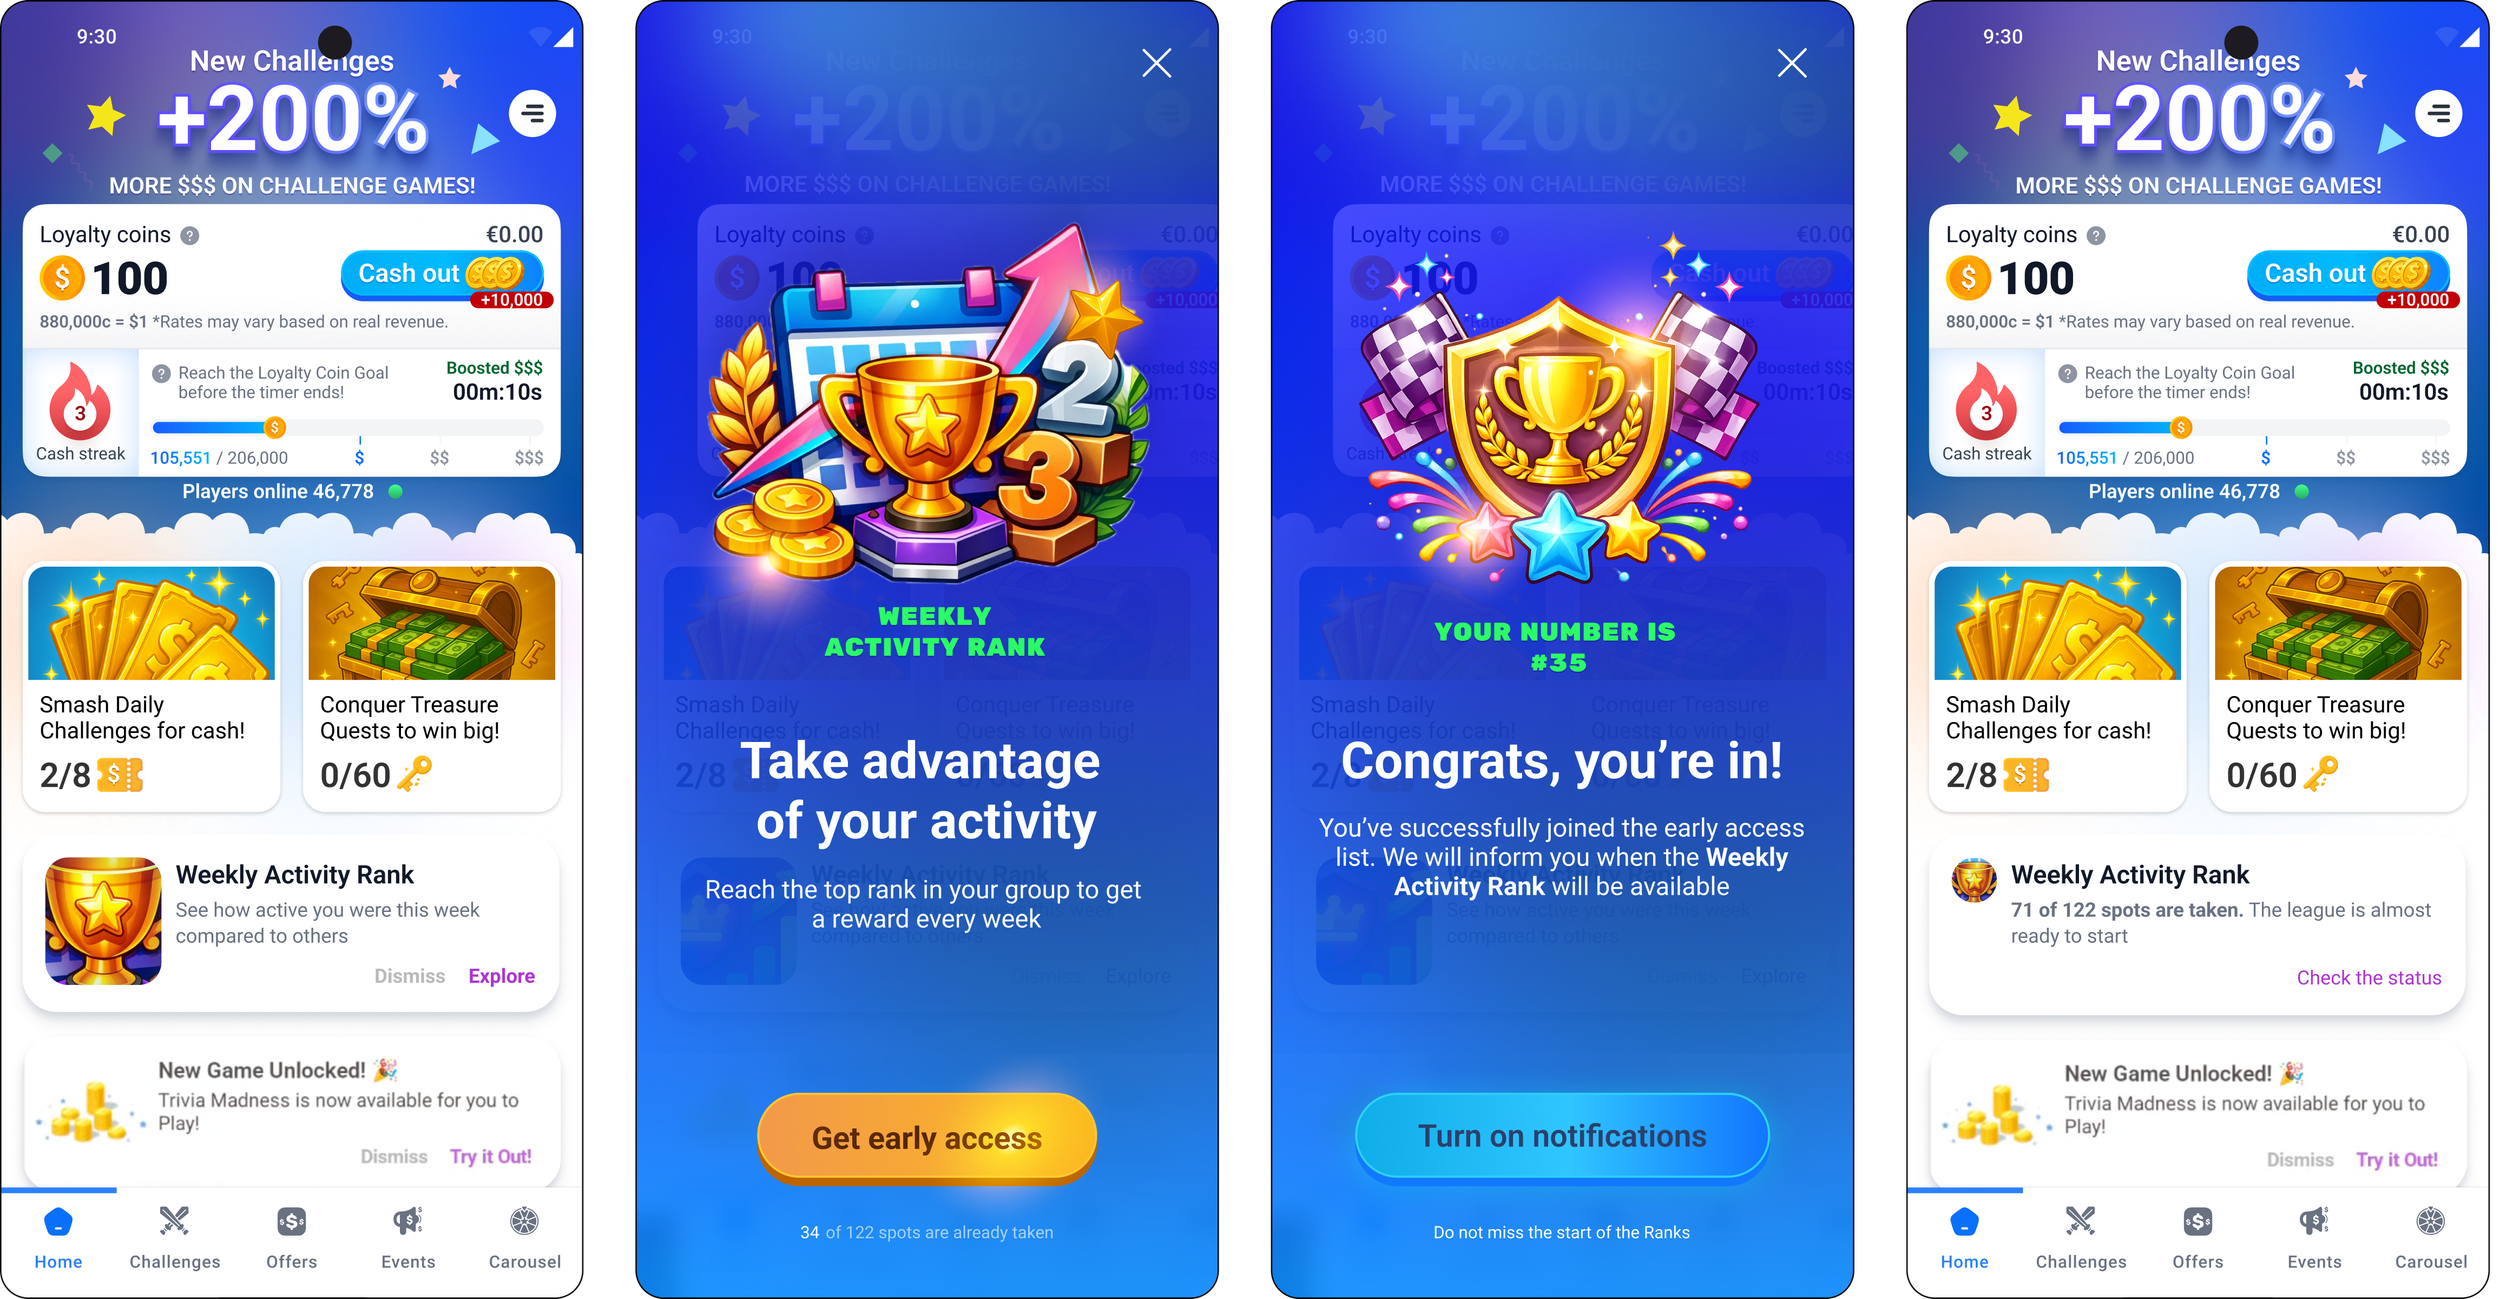
Fakedoor test’s flow
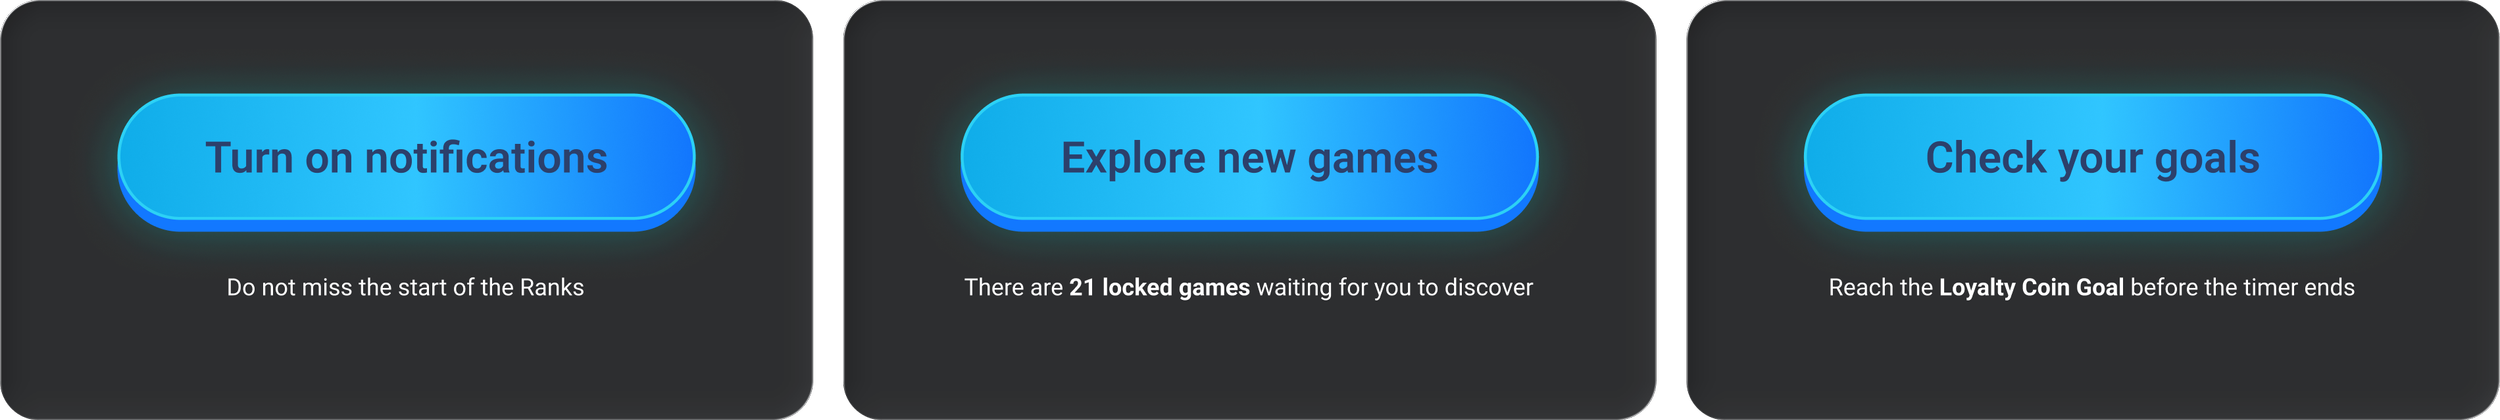
Secondary CTA tests
This module already aggregates multiple motivation triggers. By testing here, we can measure intent, return behaviour, and secondary actions without building new navigation or flows. The interaction cost for users is low, but the behavioural signal is strong.
Secondary CTAs act as directional indicators.
If users exposed to comparison are more likely to enable notifications, explore games, or revisit goals, it suggests that competition increases engagement rather than distraction.
This allows to validate retention impact early, before committing to heavier leaderboard mechanics.
Stage 02. P2P battle
Active decision
Leaderboards are passive.. You don't choose to participate. You open the app, find yourself ranked 143 of 150, and wonder: who are these people? Why am I here? There's no agency. No decision to compete.
Battles are active decisions. You choose to play or not. The choice (the decision to compete) is the cheapest way to measure real competitive spirit at scale. When users actively choose to battle, you're measuring genuine engagement, not vanity rankings. The gap between passive leaderboards and active battles reveals who actually wants to compete versus who's just watching.
How does it correlate with leaderboards?
Interest in participation in a social competition, not just personal progress
Metrics
Tap rate (baseline interest)
Repeat engagement in the next battle
Notification permission acceptance
Session length changes the next day
Weekly Activity Rank module tests
Delivery and execution framing
4 weeks sprint alignment
The goal is to learn whether leaderboards should scale by catching signals early and avoiding building the wrong thing
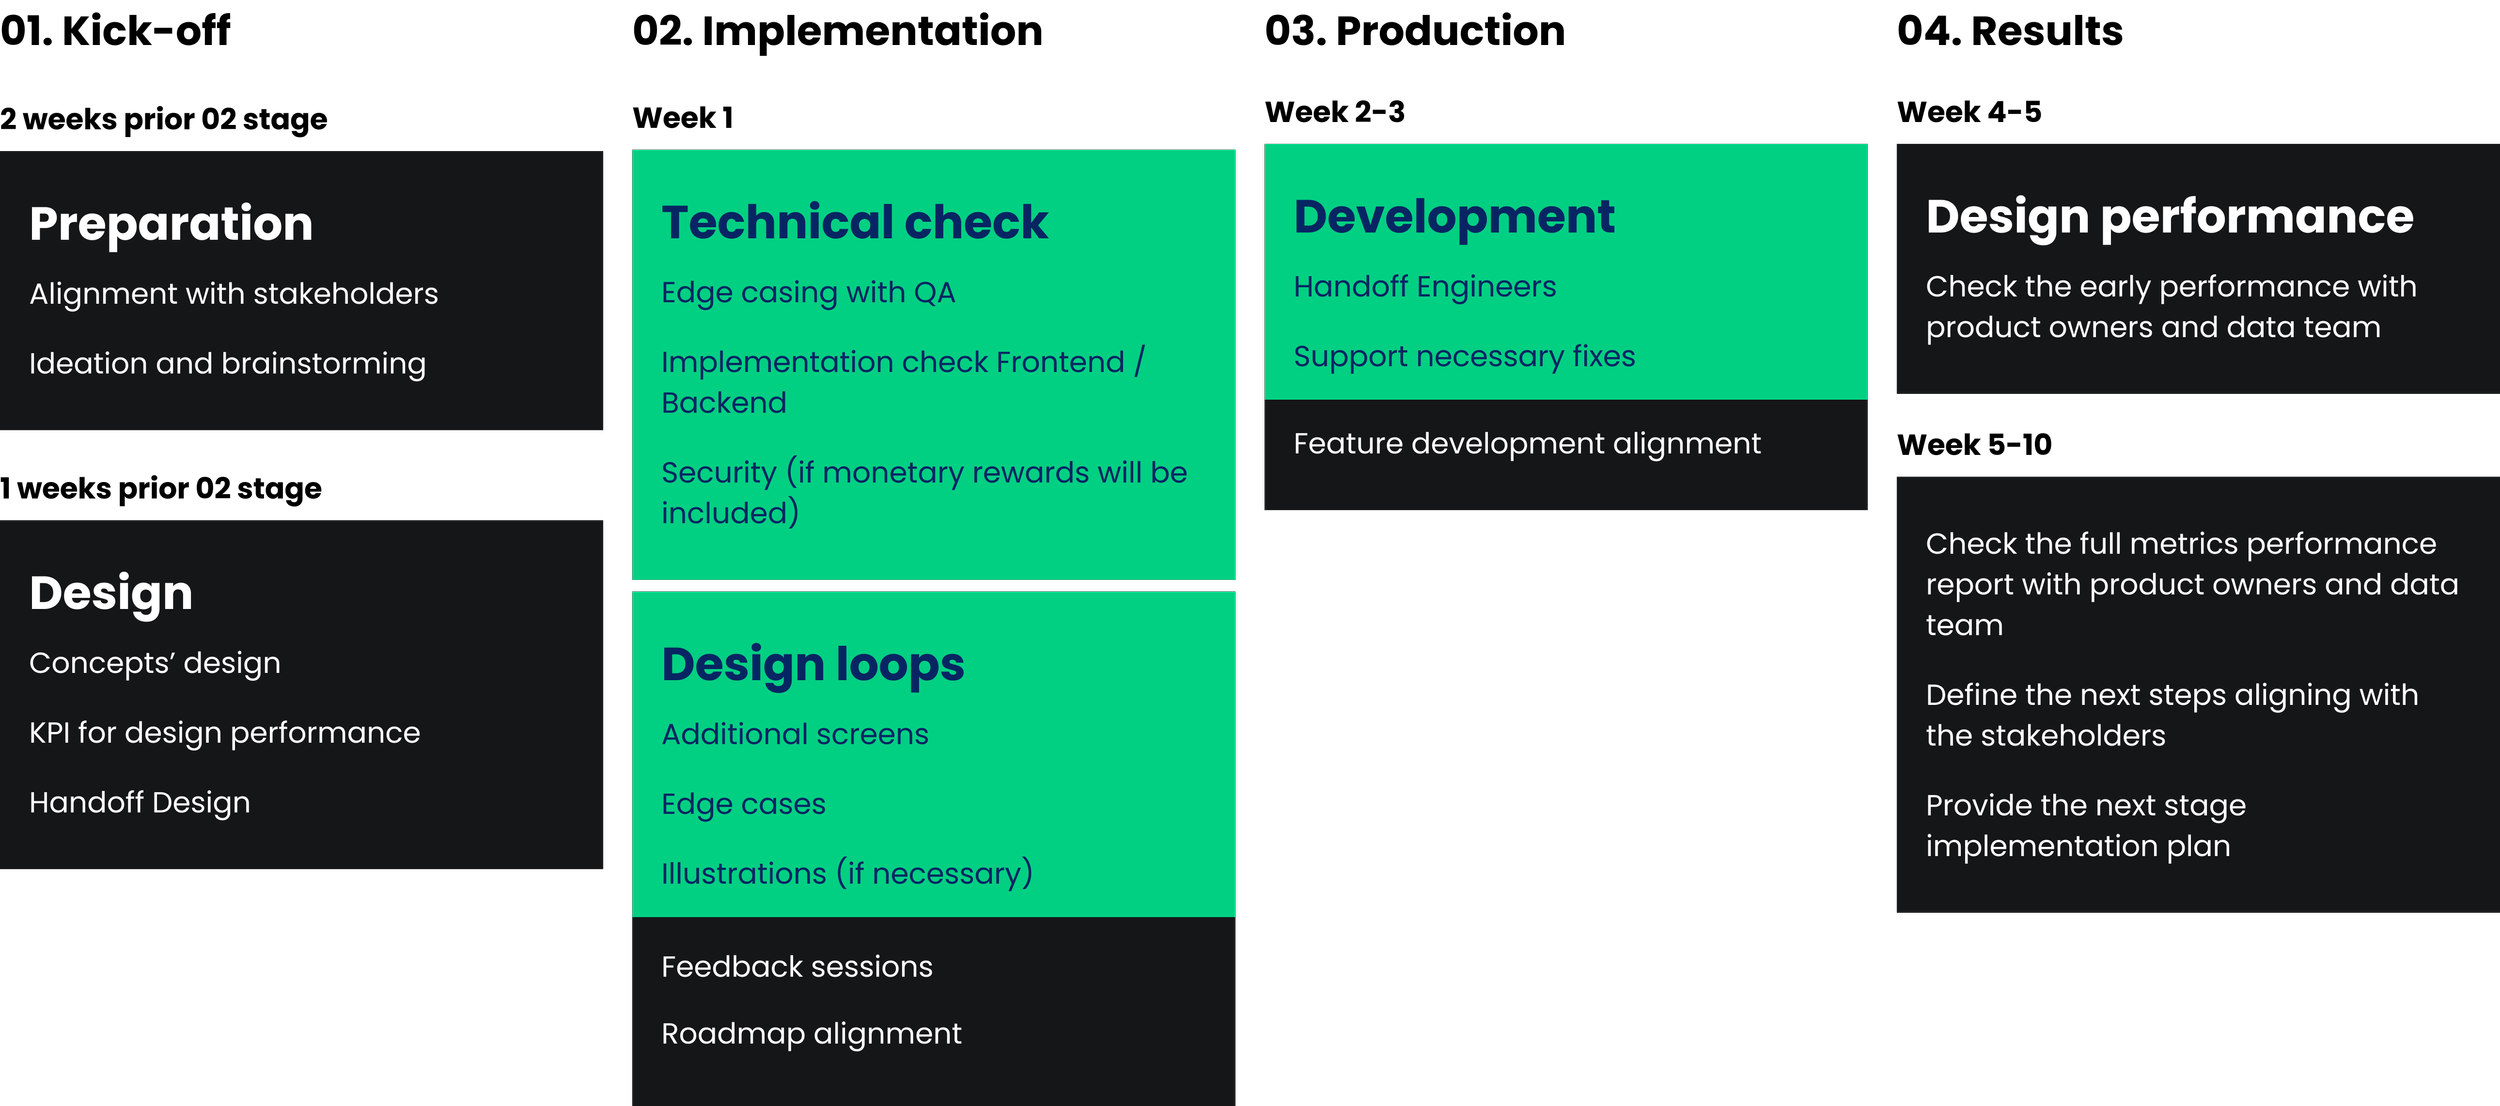
Milestones
1. User tests shipped to production > 2. Data collected > 3. POC report
Risks
False positive signals driven by curiosity rather than sustained behaviour change (that’s why D30 retention is important to track)
Perceived unfairness, or behaviour that negatively impacts retention
Scope creeps toward the full feature production
The feature can attract the wrong cohort of already sticky power users, inflate metrics while failing to improve the mid-tier sticky users
Dependencies
Engineering feasibility
Fast feedback loops between design, product, and analytics
Growth horizon
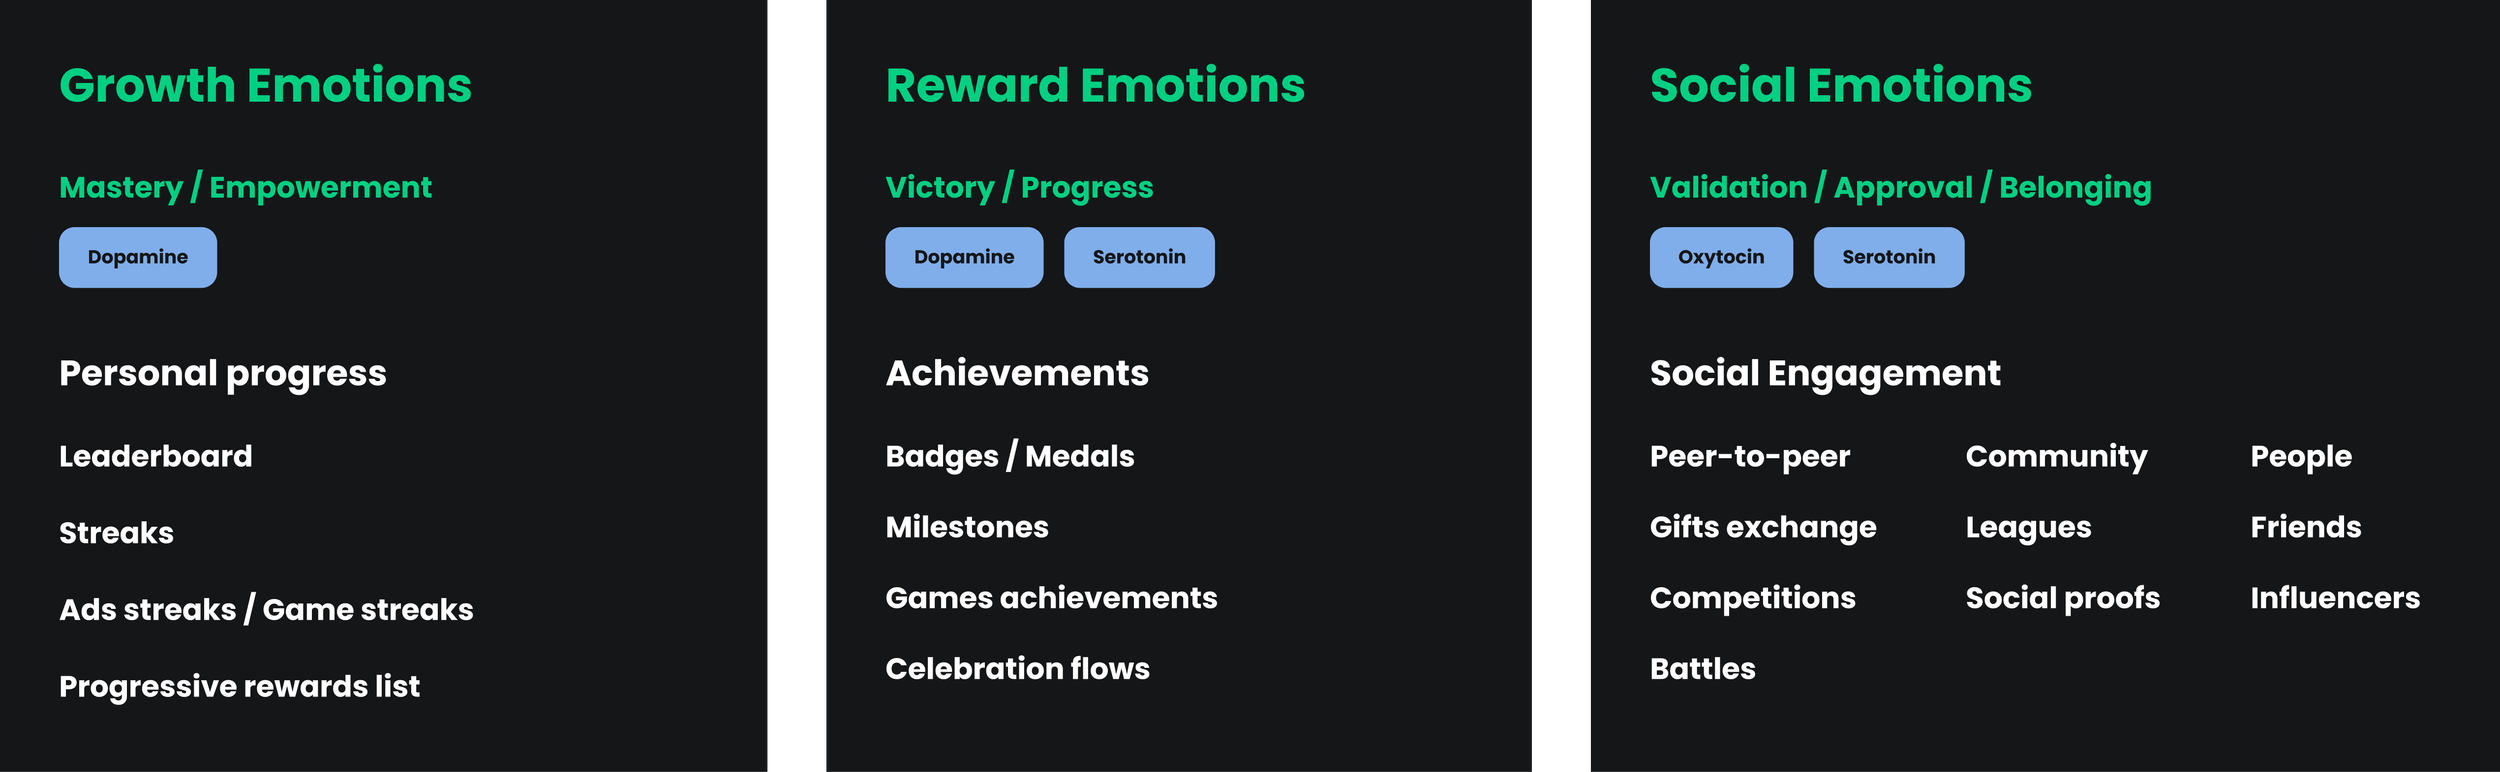
The longer-term recommendation was to treat competition as one module inside a scalable engagement engine, not a standalone feature.
That meant building a roadmap across three emotional drivers:
growth emotions (mastery and progress),
reward emotions (victory and achievements)
social emotions (belonging and peer interaction)
The horizon plan also made risks explicit: false positives from novelty, perceived unfairness that can damage retention, and increased fraud pressure in a real-money environment, so the system should evolve only when measurement shows sustained behavior, not curiosity spikes.
Scalable engagement engine
The leaderboard is one of the sticky tools in an engagement engine.
The scalable engagement engine should be build based on the emotional map rather than behavioural. Positive emotional outcome increase stickiness and reduce ads fatigue, add more purpose to use the app, build tolerance to interruptions.
Pleasure / Reward system:
Action → Reward → Dopamine
Community → Belonging → Oxytocin
Effort → Success → Serotonin

Retention drivers
Outcome
This project reinforced a simple rule: competition does not create retention. It amplifies emotion. If most users feel they cannot win, the system quietly teaches them to stop trying. It also clarified how I advise under constraints. When real time updates and complex reward logic are hard, the answer is not to polish the leaderboard.
The answer is to simplify the bet, validate intent early, and build only what the data earns. Bottom line, this work helped the team shift from a feature mindset to a measurable engagement strategy with clearer KPIs, clearer tradeoffs, and lower execution risk.
Continue exploring advisory work for startups and scaleups

Advisory project
Fintech UX Audit for Investor Trust
Fintech advisory case on UX audit, investor trust, and financial clarity. Focused on improving scannability, data credibility, and interface decisions to make the product more pitch-ready and trustworthy for investors.
Industry: Fintech
Focus: UX audit, investor trust, financial clarity
Role: Design Advisory
Product design case studies